Statistics
Yes, I know.
digitalized data and automated reporting
Even with strong developments in the digital workplace and home office, know what is going on.
Working in one system enables to capture all the information you need to analyse and re-calibrate your strategy and actions.
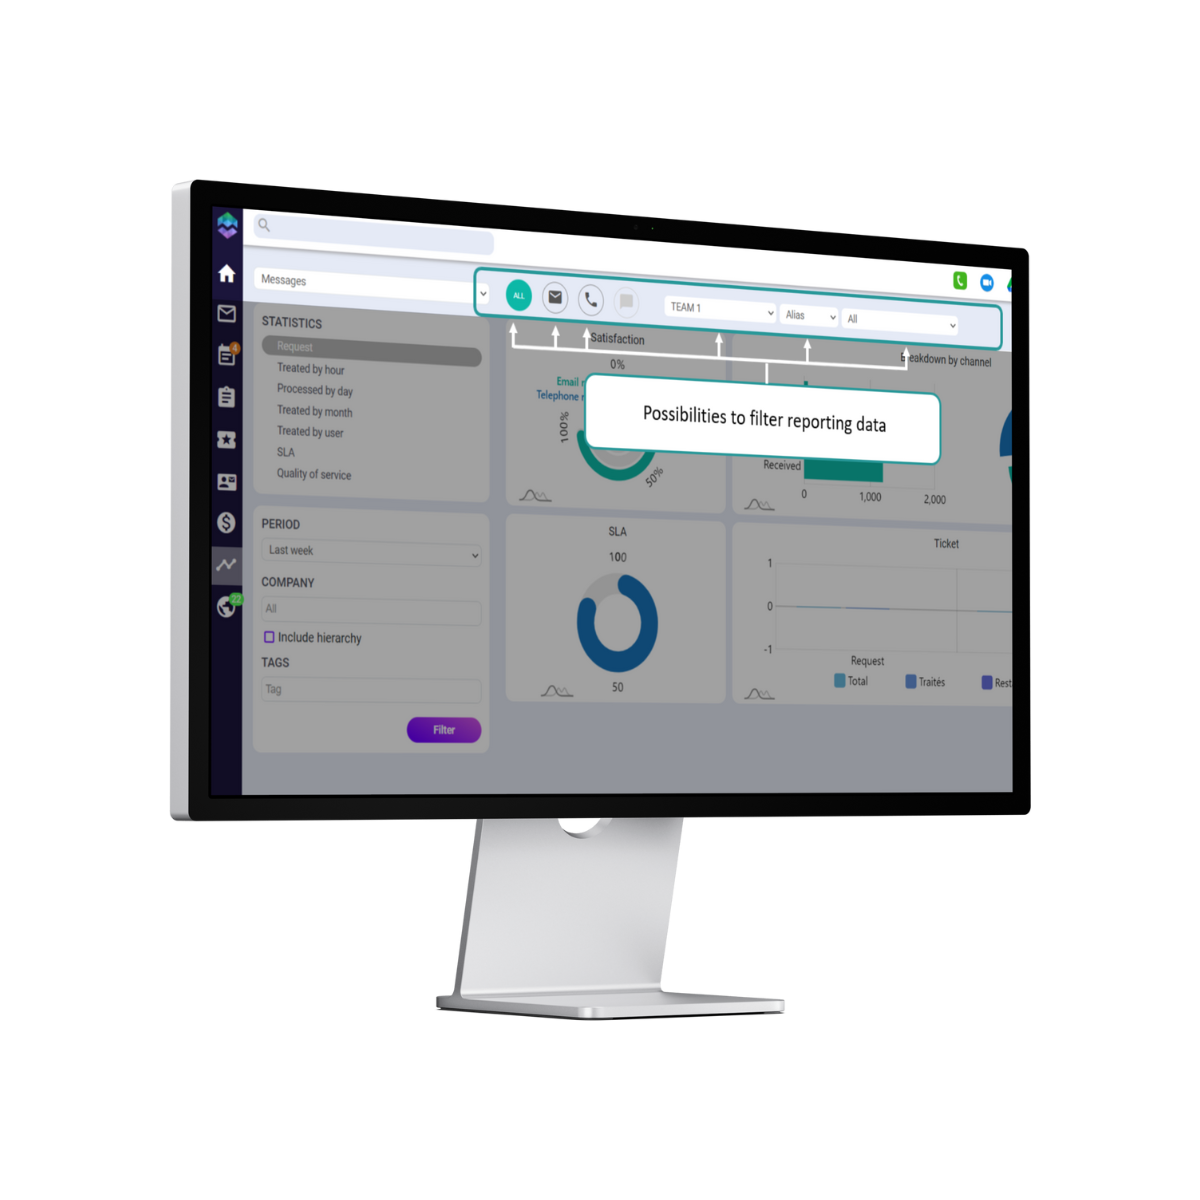
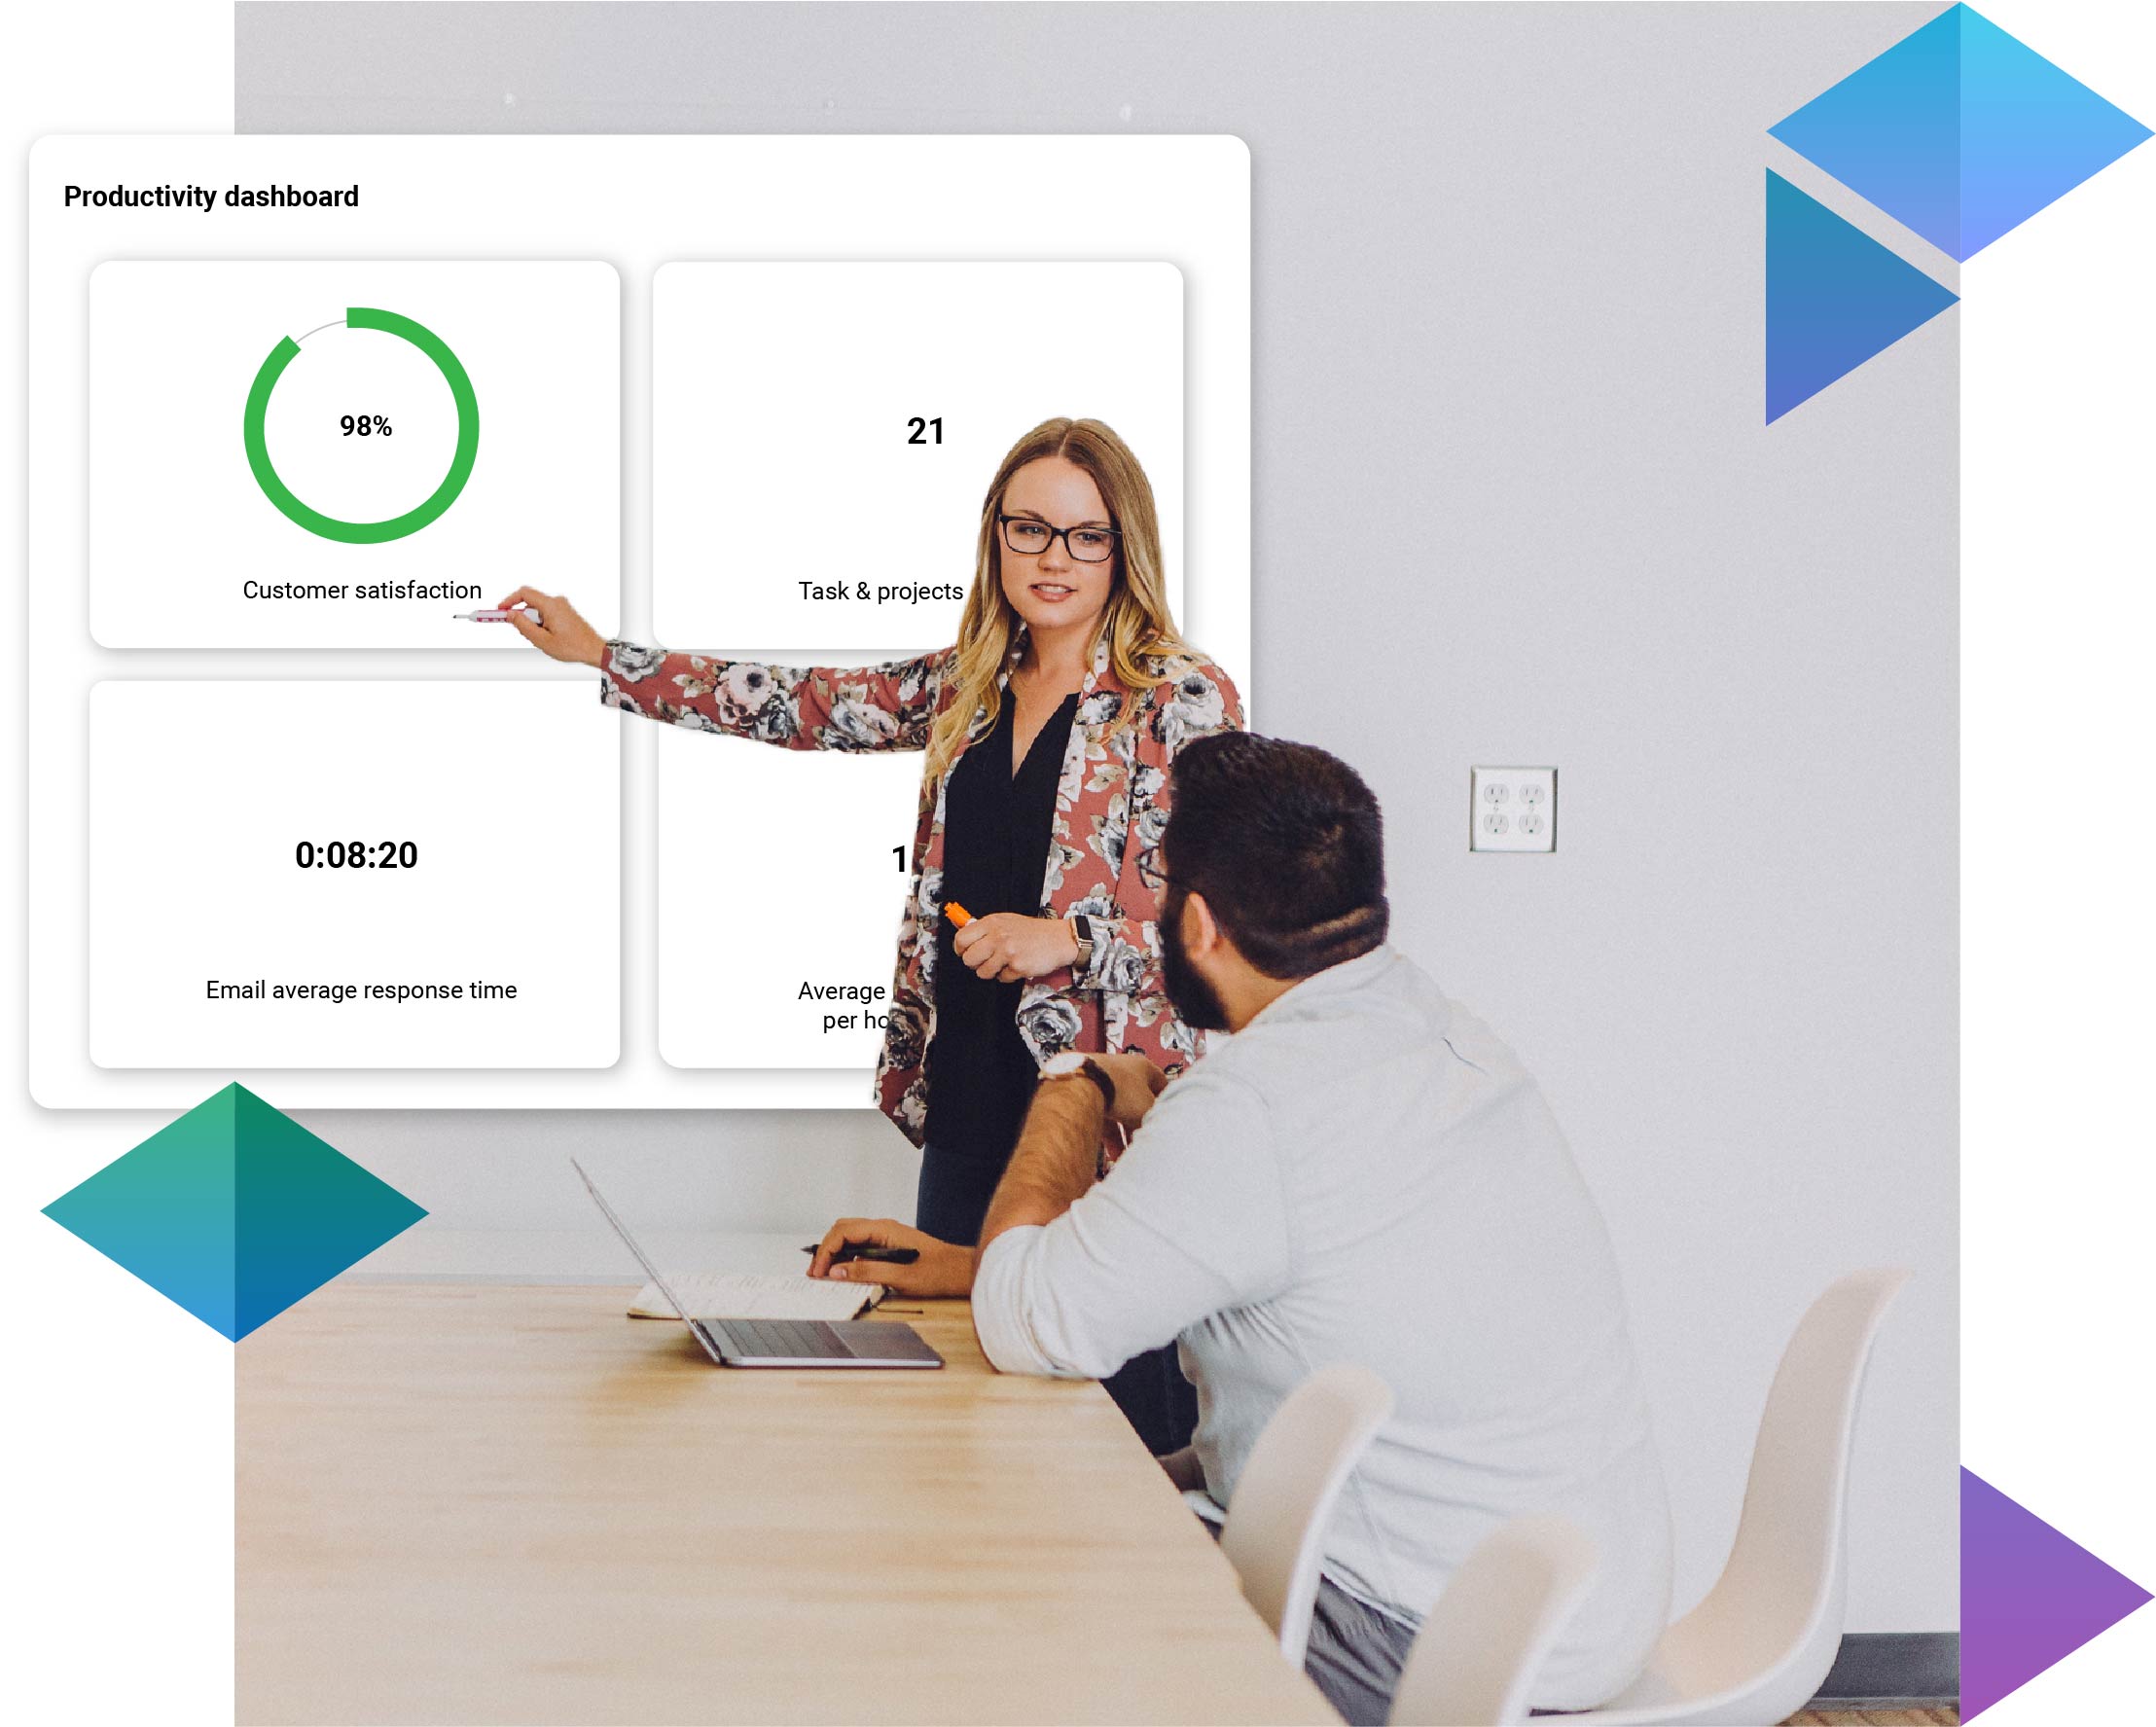
MyOverview automatically provides all the metrics you require – from your customer satisfaction to your team’s productivity.

With the MyOverview dashboard, managing your data becomes a golden dashboard.
This centralisation means you can efficiently capture the data you need to analyse and adapt your strategies.
With MyOverview, the automation of statistics is a major advantage. Key performance indicators (KPIs) such as customer satisfaction and team productivity are automatically collected and presented in a clear and concise way.
This automation gives managers and decision-makers a real-time view of the company’s performance, without the need for complex manual analysis.
Data on the percentage processed per hour, per day, per month and per user provides valuable insights into communication trends and team workloads.
The dashboard goes beyond simply displaying data

Data centralisation

Analysis of communication channels

Detailed reports
What is their opinion of MyOverview?
‘Since we started using MyOverview, the way we work has changed completely. The statistical tool is particularly useful, providing a precise view of our performance. It improves collaboration and makes our processes smoother. By centralising our operations, it simplifies management and boosts our productivity. A real asset for the whole team.’
Discover the other features
Benefit from the All-In-One approach for your daily work and discover all the functionalities integrated in MyOverview
Enhance
Communication
Intuitive
Cooperation
Increased
Productivity
Easy
Coordination
Shared
Knowledge
Problems
Solved
Informal
Collaboration
Help!
Focus on customers


